Journal: bioRxiv
Article Title: Cardiomyocyte-fibroblast interaction regulates ferroptosis and fibrosis after myocardial injury
doi: 10.1101/2023.02.07.527364
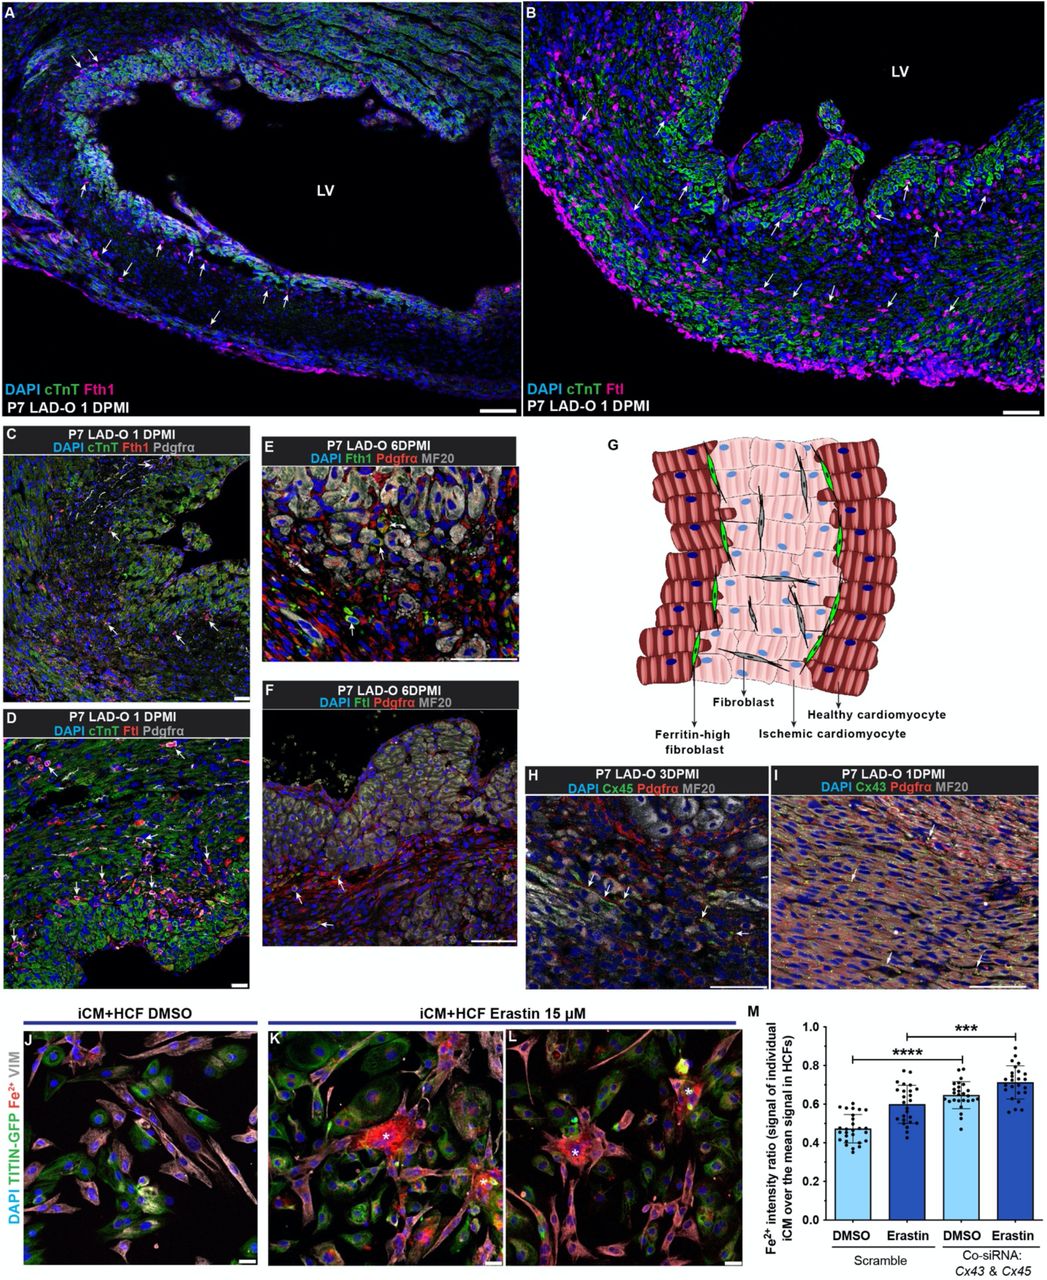
Figure Lengend Snippet: (A, B) Wild type mouse heart tissue stained for Fth1 (magenta, A) or Ftl (magenta, B), with cTnT (green) and DAPI (blue) at 1DPMI after P7 LAD-O. Arrows, non-cardiomyocytes positive for Fth1 (A) or Ftl (B). (C, D) Mouse heart tissue stained for Fth1 (red, C) or Ftl (red, D), with Pdgfrα (grey), cTnT (green) and DAPI (blue) at 1 DPMI after P7 LAD-O. Arrows, cells positive for Pdgfrα and Fth1 (C) or Ftl (D). (E, F) Mouse heart tissue stained for Fth1 (green, E) or Ftl (green, F), with Pdgfrα (red), MF20 (grey) and DAPI (blue) at 6 DPMI after P7 LAD-O. Arrows, cells positive for Pdgfrα and Fth1 (E) or Ftl (F). (G) Diagram of cardiomyocyte-fibroblast interaction after MI. (H, I) Mouse heart section stained for Cx45 (green, H) or Cx43 (green, I) with Pdgfrα (red), MF20 (grey) and DAPI (blue) after P7 LAD-O. Arrows, potential locations of gap junctions between cardiomyocytes and fibroblasts. (J-L) Co-cultured iCM and HCF stained for VIMENTIN (VIM, Grey), free Fe 2+ (red), DAPI (blue), and imaged with TITIN-GFP (green) after DMSO (J) or erastin (15 μM) (K, L) treatment. Asterisks, HCFs with accumulation of Fe 2+ . (M) siRNA knockdown of CX43 and CX45 simultaneously in iCM-HCF co-culture, Fe 2+ fluorescent intensity ratio of iCMs over HCFs was quantified after erastin or DMSO treatment. LV, left ventricle. Error bars indicate SD. ***, p<0.001; ****, p<0.0001. Scale bar, 75 μm (A, B, E, F, H, I), 25 μm (C, D, J-L). See also Figure S4 and S5.
Article Snippet: HCF cells (Cell Applications Inc, 306V-05a) were cultured in HCF Growth Medium (Cell Applications Inc, 316-500).
Techniques: Staining, Cell Culture, Knockdown, Co-Culture Assay